Tested Products
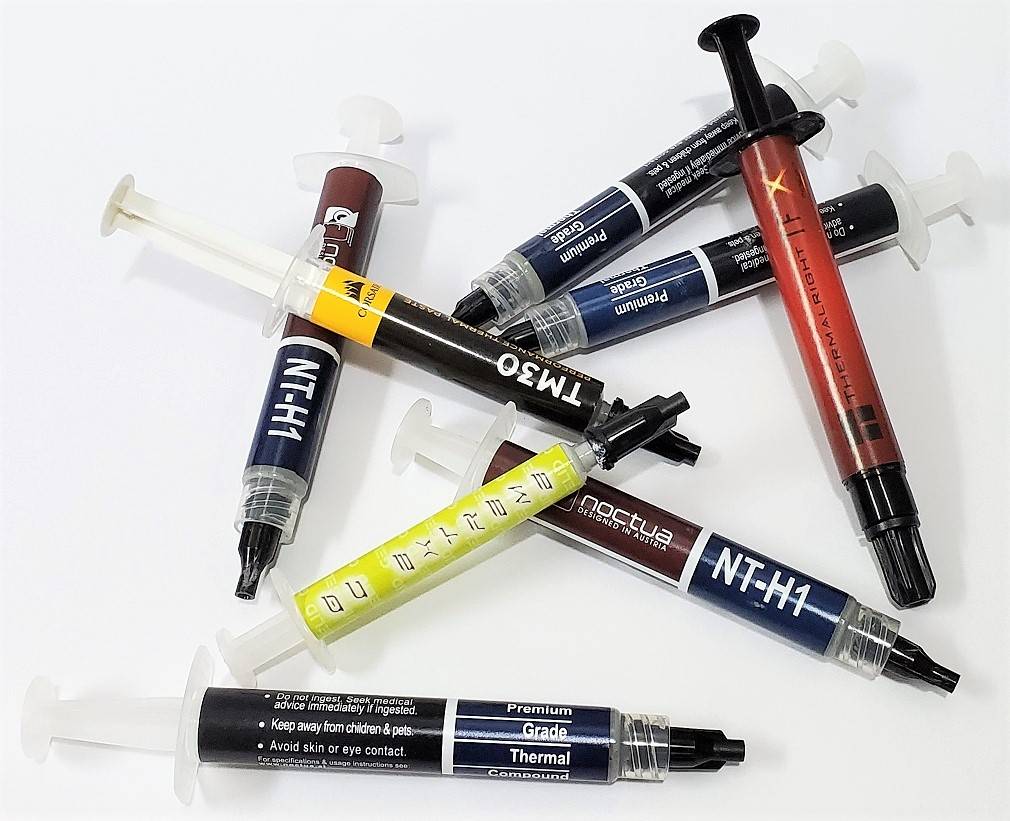
| Brand | Model | Thermal Conductivity (W/mK) | Weight (g) | Temperature Difference (°C) | Review Score |
|---|---|---|---|---|---|
| Noctua | NT-H2 | N/A | 3.5 / 10 | 50.1 | 84 |
| Streacom | TX13 | 13.4 | 1.25 | 52.67 | 82.67 |
| Corsair | TM30 | 3.8 | 3 | 54.97 | 79.33 |
| Thermalright | TFX | 14.3 | 2 / 6.2 | 50.5 | 76 |
| Noctua | NT-H1 | N/A | 3.5 / 10 | 51.27 | N/A |
| GELID | GC Extreme | 8.5 | 3.5 | 53.87 | N/A |
| Arctic | MX-2 | 5.6 | 4 | 52.7 | N/A |
| Thermalright | TF4 | 9.5 | 4 | 51.53 | N/A |
| CRYORIG | CP7 | 8.3 | 4 | 52.27 | N/A |
- “Thermal Conductivity” data is provided by the manufacturers.
- “Temperature Difference” is an average of our benchmark results.
- “Review Score” is an average of the three categories (Unboxing, Performance, Value).
Testing Methodology
To find out the performance for each thermal compound, a total of three benchmarks are included. AIDA64 is used to run a CPU stress test. CPU, FPU and system cache are all stressed to create as much heat output as possible. Also, Cinebench R15 and Cinebench R20 are used to simulate real-world CPU load (like video-editing or rendering). They will be run continuously for three times. The highest CPU package temperatures are recorded. Results will be taken at 100% fan speed, controlled via the motherboard CPU PWM fan header. Only single-fan configuration will be used in the benchmark.
| Testbench | Version 1 | Version 2 |
|---|---|---|
| CPU | AMD Ryzen 5 1600X @ 3.6 GHz (95W TDP) | Intel Core i7-9700K @ 4.80 GHz @ 1.30 V (~150W TDP) |
| CPU Cooler | Noctua NH-U12S (its review here) | Noctua NH-U12S (its review here) |
| Motherboard | MSI B350M GAMING PRO (its review here) | ASRock Z370 Killer SLI |
Our Benchmarking Results
[visualizer id=”13885″ lazy=”no” class=””]
[visualizer id=”3304″ lazy=”no” class=””]
Check out our full reviews for more detailed explanations and analysis.


