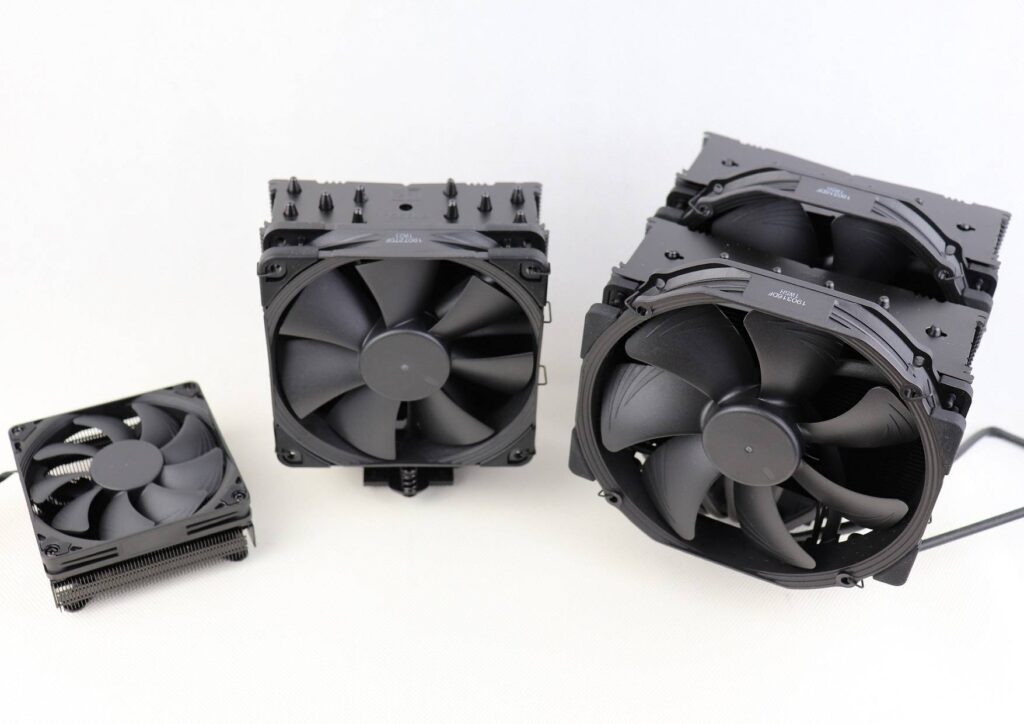
Tested Products
| Brand | Model | Type | Fan Setup | Review Score |
|---|---|---|---|---|
| Noctua | NH-D15S | Air | 1 x 140 mm | 90 |
| Noctua | NH-U12A | Air | 2 x 120 mm | 84.33 |
| Corsair | iCUE H115i ELITE CAPAELLIX | Water | 2 x 140 mm | 84.33 |
| Noctua | chromax.black | Air | N/A | 84 |
| Corsair | iCUE H150i RGB PRO XT | Water | 3 x 120 mm | 83.33 |
| Noctua | NH-U14S | Air | 1 x 140 mm | 83.33 |
| Noctua | NH-L12S | Air | 1 x 120 mm | 83.33 |
| Noctua | NH-U12S redux | Air | 1 x 120 mm | 83 |
| SilverStone | PF240-ARGB | Water | 2 x 120 mm | 82.67 |
| Corsair | A500 | Air | 2 x 120 mm | 82.67 |
| Noctua | NH-C14S | Air | 1 x 140 mm | 82.67 |
| Noctua | NH-L12 Ghost S1 | Air | 1 x 92 mm | 82.33 |
| GELID | SIROCCO | Air | 1 x 120 mm | 82.33 |
| Noctua | NH-U12S | Air | 1 x 120 mm | 82.33 |
| GELID | Phantom Black | Air | 2 x 120 mm | 82.33 |
| GELID | Phantom | Air | 2 x 120 mm | 82.33 |
| Noctua | NH-P1 | Air | N/A | 82.33 |
| CRYORIG | R5 | Air | 2 x 140 mm | 82 |
| Noctua | NH-U9S | Air | 2 x 92 mm | 81.67 |
| Noctua | NH-L9x65 | Air | 1 x 92 mm | 81.67 |
| SilverStone | IceGem 240P | Water | 2 x 120 mm | 81.67 |
| Thermalright | Turbo Right 240/360 C | Water | 2 x 120 mm 3 x 120 mm | 81.33 |
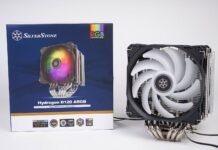
| SilverStone | Hydrogon D120 ARGB | Air | 2 x 120 mm | 80 |
| RAIJINTEK | LETO PRO RGB | Air | 2 x 120 mm | 78.33 |
| SilverStone | AR11 | Air | 1 x 92 mm | 78 |
| RAIJINTEK | PALLAS 120 RGB | Air | 1 x 120 mm | 71.67 |
- “Review Score” is an average of the three categories (Unboxing, Performance, Value).
Testing Methodology
To find out how the cooler performs, a total of three benchmarks are included. AIDA64 is used to run a CPU stress test. CPU, FPU and system cache are all stressed to create as much heat output as possible. Also, Cinebench R15 and Cinebench R20 are used to simulate real-world CPU load (like video-editing or rendering). It will be run continuously for three times.
Results will be taken at a 50% and 100% fan speed, controlled via the motherboard CPU PWM header. Stress test will run for at least 15 minutes. Once the CPU has reached the equilibrium temperature, we will record both the average and highest temperatures of the CPU package/hottest core with HWiNFO in the next 5 minutes.
| Testbench | Version 1 | Version 2 |
|---|---|---|
| CPU | AMD Ryzen 5 1600X @ 3.6 GHz (95W TDP) | Intel Core i7-9700K @ 4.80 GHz @ 1.30 V (~150W TDP) |
| Motherboard | MSI B350M GAMING PRO (its review here) | ASRock Z370 Killer SLI |
| Thermal Compound | Noctua NT-H1 | Noctua NT-H1 |
Our Benchmark Results
[visualizer id=”8645″ lazy=”no” class=””]
[visualizer id=”10498″ lazy=”no” class=””]
[visualizer id=”5998″ lazy=”no” class=””]
[visualizer id=”6155″ lazy=”no” class=””]
[visualizer id=”2873″ lazy=”no” class=””]


