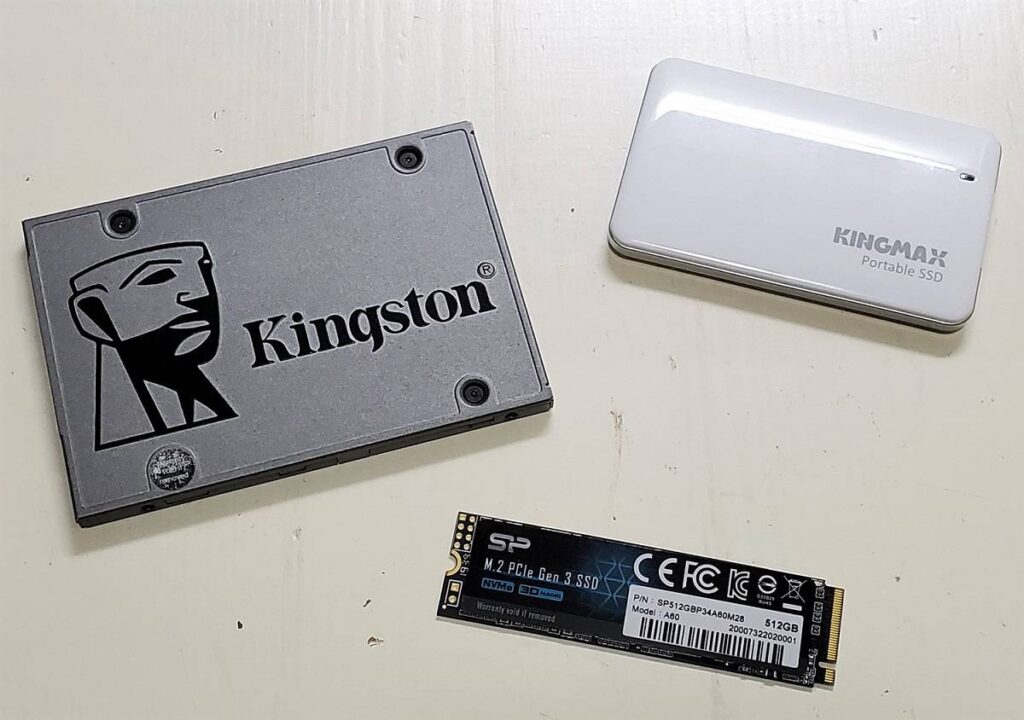
Tested Products
| Brand | Model | Interface | Capacity | NAND Flash | Review Score |
|---|---|---|---|---|---|
| Sabrent | Rocket 3.0 | PCIe 3.0 | 2 TB | TLC | 87 |
| Asura | Genesis Xtreme | PCIe 3.0 | 1 TB | TLC | 87 |
| Sabrent | Rocket Q | PCIe 3.0 | 2 TB | QLC | 86.67 |
| Sabrent | Rocket Nano Rugged | USB | 2 TB | TLC | 85.67 |
| SK hynix | Gold P31 | PCIe 3.0 | 1 TB | TLC | 83.67 |
| Kingston | A2000 | PCIe 3.0 | 1 TB | TLC | 83.67 |
| SilverStone | MS12 | USB | N/A | N/A | 83.67 |
| Silicon Power | P34A80 | PCIe 3.0 | 1 TB | TLC | 83.33 |
| Kingston | XS2000 | USB | 1 TB | TLC | 83.33 |
| Western Digital | WD BLUE 3D NAND | SATA | 1 TB | TLC | 83.33 |
| Silicon Power | UD70 | PCIe 3.0 | 1 TB | QLC | 83 |
| SilverStone | MS11 | USB | N/A | N/A | 82.33 |
| Silicon Power | XD80 | PCIe 3.0 | 2 TB | TLC | 82 |
| Silicon Power | P34A60 | PCIe 3.0 | 1 TB | TLC | 81.67 |
| Silicon Power | Bolt B75 Pro | USB | 1 TB | TLC | 81.67 |
| Kingston | A1000 | PCIe 3.0 | 480 GB | TLC | 81 |
| Silicon Power | PC60 | USB | 960 GB | TLC | 81 |
| Kingston | KC2500 | PCIe 3.0 | 1 TB | TLC | 80.67 |
| Kingston | KC2000 | PCIe 3.0 | 1 TB | TLC | 80.33 |
| OWC | Aura P12 | PCIe 3.0 | 2 TB | TLC | 80.33 |
| SK hynix | Gold S31 | SATA | 1 TB | TLC | 80 |
| Kingston | KC600 | SATA | 1 TB | TLC | 79.33 |
| KINGMAX | PX3480 | PCIe 3.0 | 256 GB | TLC | 78.5 |
| HyperX | FURY RGB | SATA | 480 GB | TLC | 78.33 |
| Silicon Power | Superior V30 | UHS | 128 GB | N/A | 78.33 |
| Kingston | UV500 | SATA | 480 GB | TLC | 77.67 |
| Seagate | ST1000DM010 | SATA | 1 TB | N/A | 76.67 |
| Toshiba | DT01ACA100 | SATA | 1 TB | N/A | 76.67 |
| Western Digital | WD10EZEX | SATA | 1 TB | N/A | 76.67 |
| HyperX | SAVAGE EXO | USB | 480 GB | TLC | 76 |
| ZOTAC | SONIX | PCIe 2.0 | 480 GB | MLC | 75 |
| Kingston | UV400 | SATA | 480 GB | TLC | 74.33 |
- “Review Score” is an average of the three categories (Unboxing, Performance, Value).
Testing Methodology
CrystalDiskMark can measure both sequential and random 4KB read/write speeds with a queue depth of 32. ATTO Disk Benchmark can test how the drive performs across different transfer block sizes, mostly in a sequential environment. AS SSD Benchmark can provide both normal read/write speed and the IOPS performance of the drive. HD Tune Pro can be used to simulate a large file transfer of up to 100 GB. We also recorded the time to copy three files of 10 GB, 500 MB and 250 MB from a RAM disk to the SSD, to simulate a real-world situation.
| Testbench | Version 1 | Version 2 |
|---|---|---|
| CPU | Intel Core i5-8400 @ 2.9 GHz (65W TDP) | Intel Core i7-9700K @ 4.80 GHz @ 1.30 V (~150W TDP) |
| CPU Cooler | Noctua NH-U12S (its review here) | Noctua NH-U12S (its review here) |
| Motherboard | ASRock Z370 Killer SLI | ASRock Z370 Killer SLI |
| RAM | HyperX Predator RGB DDR4-3600 16 GB kit (its review here) | HyperX Predator RGB DDR4-3600 16 GB kit (its review here) |
Our Benchmark Results
[visualizer id=”2840″]
[visualizer id=”14404″]
[visualizer id=”2842″]
[visualizer id=”14406″]
[visualizer id=”4796″]
[visualizer id=”9024″]
[visualizer id=”9022″]
Check out our full reviews for more detailed explanations and analysis.


